Tuesday, July 15, 2008

Meta Data

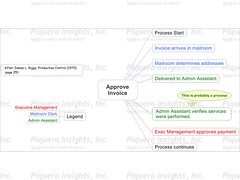
I mentioned in an earlier post that there are actually two maps in a process map, the meta data and the process steps.

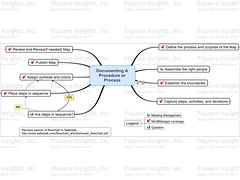
What I was driving at is kind of a mixture of project management and six-sigma. The following map is an example of what I would consider meta data for a process. This is important information to have about the process that wouldn’t be in the steps of the process.

MetaProcessMap

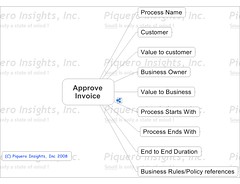
I remarked to my audience that this map is more suitable to upper management discussions about the process. If you can’t articulate a value to the customer, why have the process at all.

You would normally attach or hyperlink important documents to this map. In this example I have hyperlinked to the process map for Approve Invoice. That’s why there is a little icon in the lower right of the central topic.

I uploaded the map to Flickr. Click the map to go there and see a better image, many sizes are available.

Monday, July 14, 2008

A Flowchart Map

The second example demonstrates the same idea of a process description. This one is more on the order of a clockwise map. The first step is at the one o’clock position.


This map is a rewrite of a flowchart in a whitepaper put out by Saferpak. The paper discusses how to construct a process flowchart. I wanted to show the steps for constructing a process description.

Constructingsaferpak

Notice the decision step in the lower left-hand corner. I’m using relationship arrows to make the flow explicit.

My real reason for constructing this map was to think about how MindManager could be used to contruct a process flow. The little red checkmarks are steps that can take advantage of MindManager’s capabilities. (On second thought, you can also use MindManager to brainstorm "who to invite to the meeting.")

I uploaded the map to Flickr. Click the map to go there and see a better image, many sizes are available.

An Example Of A Process Description

A comment asked if I had any examples. I do, though some are more complex than I care to share. Some examples have company information. Instead I'll use two of the maps I used during my class. They are simple examples but make the point.

In James L. Riggs’ textbook Production Systems: Planning, Analysis, and Control (1970) there is a section on process charts. These are more the standard industrial engineering approaches, but the "process" on page 251 is simple and easy to identify with.

ApproveInvoice1

This map has been color coded to indicate who is doing the step. I’ve used a callout to indicate that a step is actually a process itself, this would link to another process map.

I uploaded the map to Flickr. Click the map to go there and see a better image, many sizes are available.

Saturday, July 12, 2008

Process Mapping

Had the class and a constructive discussion about using MindManager for process definition and discussion. Once you get past the clockwise layout of most maps it gets easier.

I wanted to emphasize a couple of key points:

  • Each process has two or more maps. One is meta data about the process. The second and other maps describe the steps of the process.
  • The use of color, putting borders around groups of topics, and using callouts help you explain key points.
  • Colors and icons can be filtered. I can reduce a complex map to just the topics of interest, i.e. the ones that need attention or elimination.
  • Data gathering is a two person task. One person builds the map and the other facilitates the meeting.
  • Keep it under 10 steps. A complicated map is probably hard to follow, and probably describe collections of steps that could be their own "process map"

There is a lot of power to using a hierarchy of maps and taaking advantage of hyperlinks to other documents. That becomes second nature after a while. It getting started that is the challenge.